DRKHASHIX AI Guderian Strategy Builder

DRKHASHIX AI Guderian Strategy Builder is an advanced automated trading robot that utilizes complex algorithms and artificial intelligence to assist you in making intelligent and efficient trades in financial markets. This is not just a robot; it’s more of a strategy builder, allowing you to create any trading strategy you desire.
Advanced Artificial Intelligence

This robot employs AI algorithms for market analysis and trade decision-making. Its precise coordination with price changes makes it an efficient tool for achieving sustainable profitability.
Signal Selection
Trading signals are just part of the process; it’s the algorithms that ensure your success. This robot offers various methods to receive trading signals. You can easily select the appropriate signal type with a simple click or activate manual mode to open trades yourself, while the robot manages the positions.
Detailed Performance Reports
The DRKHASHIX AI Guderian Strategy Builder provides detailed and comprehensive reports on trading performance, allowing you to evaluate and improve your strategies.
Risk-Free Trading
This robot helps you effectively manage trade risks. For instance, you can set it to ensure that a maximum of 2% of your capital is at risk in each trade. In this case, the AI sets your stop-loss and selects a trade volume so that if the stop-loss is activated, your account only incurs a 2% loss.
Trade Closing Using Moving Averages (MA)
This feature uses two moving averages to analyze open trades. If a trade reaches a specified profit level and the averages cross each other, the robot will close the trade before reaching the take profit (TP), ensuring a secure exit. This feature can only be set for the first trade of the robot.
Differences Between Rommel and Guderian Robots
1. Type of Trades:
Rommel Robot: This robot operates on a single trade basis, focusing primarily on analyzing trading signals and determining risk size for selecting volume and setting stop-loss.
Guderian Robot: This robot focuses on stair-step entry volumes and averaging down to escape losses, as well as opening reverse trades in a stair-step manner. It can also effectively define Martingale strategies and utilize a combination of Martingale and reverse Martingale trades to escape before hitting the stop-loss.
2. Risk Management:
Rommel Robot: With precise calculations, it helps you effectively manage risk and select trade volumes according to the specified risk level.
Guderian Robot: It may not perform as well as Rommel in risk management, as its algorithm automatically attempts to turn every trade into a profit, making it challenging to achieve optimal risk size.
3. Flexibility in Strategies:
Rommel Robot: Its simplicity and focus on trading signals allow you to easily test and analyze various trading signals.
Guderian Robot: Although it has advanced capital management, setting strategies in this robot may be somewhat more complex, making it harder to find suitable signals.
4. Applications and Benefits:
Rommel Robot: It demonstrates its advantages in precise analysis and the creation of clear trading signals, making it suitable for traders with more defined, simpler, and general strategies.
Guderian Robot: While you may need Rommel to obtain parameters for more suitable signals, its specific complexities allow for the implementation of more intricate strategies.
Making Possible Strategies

Your trading robot has the ability to open trades step by step, with each step calculated using artificial intelligence. You can also specify the number of steps and design various strategies.
- Advanced Martingale Strategy: In this strategy, after receiving a signal, the robot opens a trade and continues to open new trades if the price moves up or down. The number of trades can be adjusted by you, and you can also specify whether the volume of each new trade should increase, decrease, or remain the same. This is an advanced version of the classic Martingale strategy.
- Large TP with Averaging Strategy: In this method, the first trade is opened with a large Take Profit (TP) target to quickly achieve profit. This large profit is secured using a risk-free approach, where the robot captures the full price movement. The goal is to eventually achieve a successful trade with a large profit—the kind of trade every trader dreams of. However, if the trade goes into a loss, the robot will open additional step trades and use averaging to try to exit the position. You can even configure the robot to make some profit during the averaging process to cover future Stop Loss (SL) costs. The primary aim is to secure big profits from the first successful trade.
- Reverse Trading Strategy if the Initial Step Trades Fail: You can set the robot to open reverse trades if the loss reaches a certain level. In this case, the robot opens new trades in the opposite direction of the initial step trades, using larger volume and bigger steps. If the reverse trades also fail to generate profit, the robot can once again reverse the trades, essentially starting over with trades similar to the initial step trades. All of these reverse trade settings are fully customizable.
- Using Stop Loss or Freezing Trades: In this robot, you can choose between using a Stop Loss or a method called “freezing trades.” In the freezing method, instead of closing a trade at a loss, the robot opens a new trade when a certain loss threshold is reached. This new trade prevents the loss from increasing or decreasing further, allowing you to reanalyze the situation later and make decisions based on updated market analysis. You can then manually manage the trades using the robot’s buttons and eventually exit without a loss. This method is recommended for professional traders and is best used in combination with a Stop Loss.
These are just a few examples of the capabilities and strategies that can be implemented in this robot. It provides a variety of advanced options for capital management and strategy execution.
Smart Manual Trading
With buy, sell, and close buttons, you can easily open or close trades manually. This feature is ideal for those who prefer to execute their trades personally, with the robot acting more as an assistant to ensure your decisions are implemented optimally.

How Smart Manual Works
Also, buttons for freezing trades and opening reverse trades as well as closing trades based on their type are embedded in this robot, which do not exist in the Rommel robot, because this robot performs step entry and intermediate gain.

AI Signal Settings

- Tradesignal: This parameter is used to select the type of signaling method. Here, we can choose which type of signals to use. We have over 30 different signal combinations, and by selecting any of them, the trading bot will execute the signals based on that specific method.
- RSI Signal Period: This parameter is used to select the RSI period.
- RSI Threshold – 50 -+ 20 = 70-30: This parameter is used to define the overbought and oversold levels of the RSI. By default, it is set at 50. If adjusted to 20, 20 units will be added to the overbought level, bringing it to 70, and 20 units will also be added to the oversold level, bringing it to 30.
- MA 1 (MA2 = MA1 X 2): This parameter is used to calculate Moving Average 1 (MA1) and Moving Average 2 (MA2). Any value selected for this parameter becomes the value for MA1, while MA2 is automatically set as double the value of MA1.
- MA 3 trend: This parameter is used to set the period for Moving Average 3.
- Candle Power Period Reference: This parameter sets the period for analyzing the total number of candles, assessing the strength of the candles within the specified period.
- Candle Power Period To Check: This parameter compares the recent number of candles with the Candle Power Period Reference to assess the strength of the candles.
- Max Candle Power: Max Candle Power calculates the candle strength obtained from the Candle Power Period Reference in relation to the Candle Power Period To Check. This strength is then used in trading signals to determine whether to allow trade openings. If the strength of green candles is high and there is no significant bearish candle strength, it prevents the bot from opening a sell trade. Conversely, if the strength of red candles is strong and there is no significant bullish candle strength, it prevents the bot from opening a buy trade. This parameter is abbreviated as CPC.
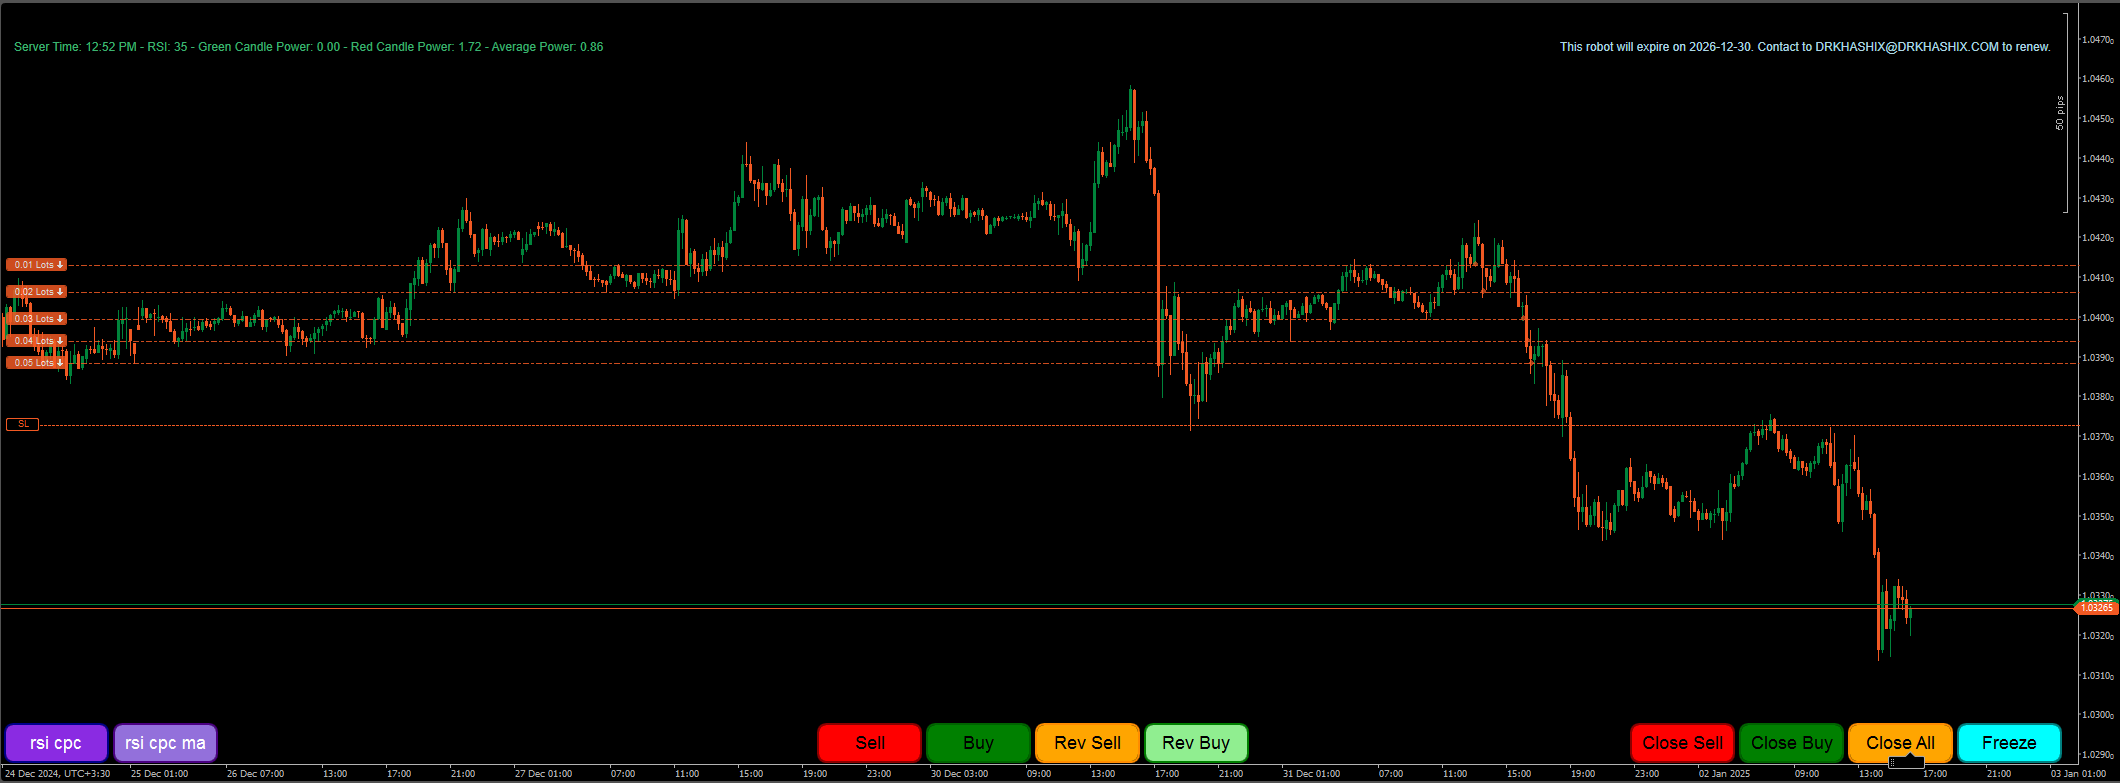
Other necessary information is always displayed on the top right of the chart.
Capital Management

- AI Management Period: In this parameter, you specify the review period for the robot’s artificial intelligence, determining how many candles it should analyze to assess where to place the pip step trade entry intervals and set the Take Profit level.
- AI Multiplier for TP: In this function, you adjust the greed level of the robot’s artificial intelligence for setting the Take Profit (TP) in step trades.
- AI Multiplier for Pip Step: In this parameter, you determine the distance between step trades based on artificial intelligence. After the first trade is opened, it sets how much the price must move before the next trade is opened. This measurement is calculated based on price fluctuations.
- AI Pip Step Increment: In this parameter, you specify how much should be added to the AI Multiplier for Pip Step with each new trade the robot opens. This ensures that for every new step trade, the robot opens the next one at a greater distance, gradually increasing the gap between trades.
- First Trade TP Multiplier: When the robot receives a signal, it sets a Take Profit (TP) for the trades. This TP measurement is primarily designed for averaging trades. However, some strategies we create with the robot focus more on the first trade, as the analysis we performed was specifically for that initial trade. Therefore, to ensure that the first trade the robot opens generates a higher profit, we use this parameter. Any number entered in this parameter will increase the robot’s greed level for adjusting the profit of the first trade. Specifically, in this robot, the risk-free strategy is applied only to the first trade, and there is no need for a Take Profit for the initial trade to implement this risk-free approach.
- Max Profit Target USD – disable = 0: In this parameter, we can separately define the maximum profit we expect from the robot. The algorithm will close all trades in that symbol whenever the robot reaches the specified profit level. To deactivate this feature, simply enter the number zero in this parameter.
- Stop Loss USD – disable = 0: In this parameter, we can separately determine the maximum loss that we expect from the robot. This algorithm, whenever the robot symbol reaches a certain loss, the robot closes all transactions in that symbol. To deactivate it, it is enough to enter zero in this parameter.
- Freez – For manual final Dance disable = 0: In this parameter, when the robot reaches a specified loss amount defined in dollars, it opens a trade to prevent any significant impact on your account if the price moves up or down. This can be viewed as an option to take action before hitting the Stop Loss. Additionally, you can manage the positions based on new analyses using the designated buttons before the Stop Loss is triggered. To deactivate it, it is enough to enter zero in this parameter.
Position Risk Free
- Enable risk free: If this option is enabled, the bot will implement risk-free trading based on AI to adjust the stop-loss to the optimal position for profit. This allows you to end up with a small trade moving against the position through the stop-loss, ultimately securing a profit.
- Risk free start pip: This parameter determines when the risk-free trading feature begins to operate. It is set based on pips, and if the price moves away from your entry point by the specified pip distance, the AI will start placing new stop-loss levels.
- AI Period for risk free: As mentioned, the bot uses AI to adjust the stop-loss towards profit. To facilitate this, we need to determine how many candles the AI should analyze. This is the AI period for evaluation.
- AI Multiplier for riskfree: Similar to the AI Courage parameter, this parameter defines the bot’s risk level for adjusting the stop-loss. The larger the number, the more conservatively the bot will move the stop-loss towards profit, placing the stops further away from the price. This way, your stop-loss is less likely to be triggered by price fluctuations, allowing you to capture the entire trend.
Closing Position in Profit with MA

- Close Position MA: This parameter determines whether we exit trades when two moving averages cross while we are in profit or not.
- Close Position MA start USD: This parameter specifies the dollar amount of profit at which we exit a trade when the moving averages cross. In other words, we need to be in profit first before exiting the trade based on the moving average crossover.
- MA 1 (MA2 = MA1 X 2): This parameter refers to Moving Averages 1 and 2, specifying that whenever the two moving averages cross, we exit the trade. The entered value represents Moving Average 1, while Moving Average 2 is set as double that value.
Reverse Trade – FIRE

- Enable Reverse Trade: Here, you specify whether you want to use reverse trades or not.
- Reverse Trade Multiplier: Here, you estimate the volume you want to use for the reverse trades.
- Reverse Profit USD: When reverse trades are opened, all limit Take Profits from your trades are removed. In this parameter, you need to specify the amount of profit at which the robot should exit the trades. For example, you can set a specific profit amount in dollars or enter zero to break even on the trades.
- Reverse step 1 USD: In this parameter, you specify the loss threshold at which the robot should open the first reverse trade.
- Reverse lot size 1: Here, you determine the calculated volume for the first reverse trade based on the Reverse Trade Multiplier you specified earlier.
- Reverse in reverse 2: Here, you specify whether the second reverse trade should be of the same type as the first reverse trade or the opposite type.
- Reverse step 2 USD disable = 0: In this parameter, you specify the loss threshold at which the second reverse trade should be opened.
The remaining parameters in the Reverse Trade section continue to follow the same formula.
Forbidden Hours
 Forbidden Hours Start – End GMT 0:
- These two parameters are used to specify the times during which the bot is not allowed to open trades. During these hours, the bot will refrain from executing any trades, allowing you to set it up to avoid trading during high volatility periods.
- The times are based on GMT (Greenwich Mean Time), which is a global reference for time determination, set according to the position of the sun and remains constant. GMT is used to standardize time in trading, flights, and event scheduling.
EXPIRATION TIME
The bot continuously displays the expiration date on the center of the chart and will alert you when the expiration date approaches.
LICENSE KEY
All of our bots have a serial number, and if anyone misuses the bots, not only will their bot be deactivated remotely, but legal action will also be taken against them. All rights related to the bots are reserved with us.
Signal Generation Guide for the Trading Robot

Key Indicators and Terms
- RSI (Relative Strength Index): Indicates overbought and oversold conditions in the market.
- RSI Filter: Prevents buy signals when the market is overbought and sell signals when the market is oversold.
- Con: Confirmation signal based on the RSI.
- CPC (Candle Power): Refers to the strength of the candlesticks.
- ma1ma2: Buy: When the short-term moving average (ma1) crosses from below the long-term moving average (ma2) and moves above it. Sell: When the short-term moving average (ma1) crosses from above the long-term moving average (ma2) and moves below it.
- MA3: When the price is above moving average (ma3), it shows a long-term upward trend, and when the price is below moving average (ma3), it shows a long-term downward trend.
- MA3Negative: Price correction; the price tends to revert to the moving average over the long term. Signals are taken in the opposite direction of the moving average.
Start Building Your Advanced Trading Strategy
Experience the power of AI-driven trading with DRKHASHIX AI Guderian Strategy Builder. Create, test, and execute your perfect trading strategy with advanced risk management and signal generation.
Get Guderian Strategy Builder
© DR.KHASHIX. All rights reserved. Trading involves risk. Past performance is not indicative of future results — trade responsibly and manage your risk.
1. Manual
Buy: A buy signal is triggered when the buy button is pressed.
Sell: A sell signal is triggered when the sell button is pressed.
buy = buyButtonPressed
sell = sellButtonPressed
2. Cazino
Buy: Closing price of the latest candle is higher than its opening, and the previous candle closes higher than it opens.
Sell: Closing price of the latest candle is lower than its opening, and the previous candle closes lower than it opens.
buy = MarketSeries.Close[lastBarIndex] > MarketSeries.Open[lastBarIndex] && MarketSeries.Close[prevBarIndex] > MarketSeries.Open[prevBarIndex]
sell = MarketSeries.Close[lastBarIndex] < MarketSeries.Open[lastBarIndex] && MarketSeries.Close[prevBarIndex] < MarketSeries.Open[prevBarIndex]
3. CPC
Buy: Red candle power ≤ MaxCandlePower, green candle power ≥ red candle power, and RSI below overbought.
Sell: Green candle power ≤ MaxCandlePower, red candle power ≥ green candle power, and RSI above oversold.
buy = redCandlePower <= MaxCandlePower && greenCandlePower >= redCandlePower && rsi.Result[lastBarIndex] < Overbought
sell = greenCandlePower <= MaxCandlePower && redCandlePower >= greenCandlePower && rsi.Result[lastBarIndex] > Oversold
4. CPC_RSIfilter
Buy: Red candle power ≤ MaxCandlePower, green candle power ≥ red candle power, and RSI below overbought.
Sell: Green candle power ≤ MaxCandlePower, red candle power ≥ green candle power, and RSI above oversold.
buy = redCandlePower <= MaxCandlePower && greenCandlePower >= redCandlePower && rsi.Result[lastBarIndex] < Overbought
sell = greenCandlePower <= MaxCandlePower && redCandlePower >= greenCandlePower && rsi.Result[lastBarIndex] > Oversold
CPC_RSIfilter_MA3
Buy: Red candle power ≤ MaxCandlePower, green candle power ≥ red candle power, RSI < overbought, and closing price ≥ 3rd moving average.
Sell: Green candle power ≤ MaxCandlePower, red candle power ≥ green candle power, RSI > oversold, and closing price ≤ 3rd moving average.
buy = redCandlePower <= MaxCandlePower && greenCandlePower >= redCandlePower && rsi.Result[lastBarIndex] < Overbought && MarketSeries.Close[lastBarIndex] >= movingAverage3.Result[lastBarIndex]
sell = greenCandlePower <= MaxCandlePower && redCandlePower >= greenCandlePower && rsi.Result[lastBarIndex] > Oversold && MarketSeries.Close[lastBarIndex] <= movingAverage3.Result[lastBarIndex]
5. CPC_RSIfilter_MA3Nega
Buy: Red candle power ≤ MaxCandlePower, green candle power ≥ red candle power, RSI < overbought, closing price ≤ 3rd moving average.
Sell: Green candle power ≤ MaxCandlePower, red candle power ≥ green candle power, RSI > oversold, closing price ≥ 3rd moving average.
buy = redCandlePower <= MaxCandlePower && greenCandlePower >= redCandlePower && rsi.Result[lastBarIndex] < Overbought && MarketSeries.Close[lastBarIndex] <= movingAverage3.Result[lastBarIndex]
sell = greenCandlePower <= MaxCandlePower && redCandlePower >= greenCandlePower && rsi.Result[lastBarIndex] > Oversold && MarketSeries.Close[lastBarIndex] >= movingAverage3.Result[lastBarIndex]
6. RSI
Buy: RSI ≤ oversold
Sell: RSI ≥ overbought
buy = rsi.Result[lastBarIndex] <= Oversold sell = rsi.Result[lastBarIndex] >= Overbought
7. RSI_Con
Buy: RSI latest ≤ oversold & RSI previous ≥ oversold
Sell: RSI latest ≥ overbought & RSI previous ≤ overbought
buy = rsi.Result[lastBarIndex] <= Oversold && rsi.Result[prevBarIndex] >= Oversold
sell = rsi.Result[lastBarIndex] >= Overbought && rsi.Result[prevBarIndex] <= Overbought
8. RSI_CPC
Buy: RSI ≤ oversold & red candle power ≤ MaxCandlePower & green candle power ≥ red candle power
Sell: RSI ≥ overbought & green candle power ≤ MaxCandlePower & red candle power ≥ green candle power
buy = rsi.Result[lastBarIndex] <= Oversold  && redCandlePower <= MaxCandlePower && greenCandlePower >= redCandlePower
sell= rsi.Result[lastBarIndex] >= Overbought && greenCandlePower <= MaxCandlePower && redCandlePower >= greenCandlePower
9. RSI_Con_CPC
Buy: RSI latest ≤ oversold & RSI previous ≥ oversold & red candle power ≤ MaxCandlePower & green candle power ≥ red candle power
Sell: RSI latest ≥ overbought & RSI previous ≤ overbought & green candle power ≤ MaxCandlePower & red candle power ≥ green candle power
buy = rsi.Result[lastBarIndex] <= Oversold && rsi.Result[prevBarIndex] >= Oversold && redCandlePower <= MaxCandlePower && greenCandlePower >= redCandlePower
sell = rsi.Result[lastBarIndex] >= Overbought && rsi.Result[prevBarIndex] <= Overbought && greenCandlePower <= MaxCandlePower && redCandlePower >= greenCandlePower
10. RSI_Con_MA3
Buy: RSI latest ≤ oversold & RSI previous ≥ oversold & closing price ≥ 3rd MA
Sell: RSI latest ≥ overbought & RSI previous ≤ overbought & closing price ≤ 3rd MA
buy = rsi.Result[lastBarIndex] <= Oversold && rsi.Result[prevBarIndex] >= Oversold && MarketSeries.Close[lastBarIndex] >= movingAverage3.Result[lastBarIndex]
sell = rsi.Result[lastBarIndex] >= Overbought && rsi.Result[prevBarIndex] <= Overbought && MarketSeries.Close[lastBarIndex] <= movingAverage3.Result[lastBarIndex]
11. RSI_Con_MA3Nega
Buy: RSI latest ≤ oversold & RSI previous ≥ oversold & closing price ≤ 3rd MA
Sell: RSI latest ≥ overbought & RSI previous ≤ overbought & closing price ≥ 3rd MA
buy = rsi.Result[lastBarIndex] <= Oversold && rsi.Result[prevBarIndex] >= Oversold && MarketSeries.Close[lastBarIndex] <= movingAverage3.Result[lastBarIndex] sell = rsi.Result[lastBarIndex] >= Overbought && rsi.Result[prevBarIndex] <= Overbought && MarketSeries.Close[lastBarIndex] >= movingAverage3.Result[lastBarIndex]
12. RSI_CPC_MA3
Buy: RSI latest ≤ oversold & red candle ≤ Max & green candle ≥ red candle & closing ≥ 3rd MA
Sell: RSI latest ≥ overbought & green candle ≤ Max & red candle ≥ green candle & closing ≤ 3rd MA
buy = rsi.Result[lastBarIndex] <= Oversold && redCandlePower <= MaxCandlePower && greenCandlePower >= redCandlePower && MarketSeries.Close[lastBarIndex] >= movingAverage3.Result[lastBarIndex]
sell = rsi.Result[lastBarIndex] >= Overbought && greenCandlePower <= MaxCandlePower && redCandlePower >= greenCandlePower && MarketSeries.Close[lastBarIndex] <= movingAverage3.Result[lastBarIndex]
13. RSI_CPC_MA3Nega
Buy: RSI latest ≤ oversold & red candle ≤ Max & green candle ≥ red candle & closing ≤ 3rd MA
Sell: RSI latest ≥ overbought & green candle ≤ Max & red candle ≥ green candle & closing ≥ 3rd MA
buy = rsi.Result[lastBarIndex] <= Oversold && redCandlePower <= MaxCandlePower && greenCandlePower >= redCandlePower && MarketSeries.Close[lastBarIndex] <= movingAverage3.Result[lastBarIndex] sell = rsi.Result[lastBarIndex] >= Overbought && greenCandlePower <= MaxCandlePower && redCandlePower >= greenCandlePower && MarketSeries.Close[lastBarIndex] >= movingAverage3.Result[lastBarIndex]
14. RSI_Con_CPC_MA3
Buy: RSI latest ≤ oversold & RSI prev ≥ oversold & red candle ≤ Max & green candle ≥ red candle & closing ≥ 3rd MA
Sell: RSI latest ≥ overbought & RSI prev ≤ overbought & green candle ≤ Max & red candle ≥ green candle & closing ≤ 3rd MA
buy = rsi.Result[lastBarIndex] <= Oversold && rsi.Result[prevBarIndex] >= Oversold  && redCandlePower <= MaxCandlePower && greenCandlePower >= redCandlePower && MarketSeries.Close[lastBarIndex] >= movingAverage3.Result[lastBarIndex]
sell = rsi.Result[lastBarIndex] >= Overbought && rsi.Result[prevBarIndex] <= Overbought && greenCandlePower <= MaxCandlePower && redCandlePower >= greenCandlePower && MarketSeries.Close[lastBarIndex]  <= movingAverage3.Result[lastBarIndex]
15. RSI_Con_CPC_MA3Nega
Buy: RSI latest ≤ oversold & RSI prev ≥ oversold & red candle ≤ Max & green candle ≥ red candle & closing ≤ 3rd MA
Sell: RSI latest ≥ overbought & RSI prev ≤ overbought & green candle ≤ Max & red candle ≥ green candle & closing ≥ 3rd MA
buy = rsi.Result[lastBarIndex] <= Oversold && rsi.Result[prevBarIndex] >= Oversold && redCandlePower <= MaxCandlePower && greenCandlePower >= redCandlePower && MarketSeries.Close[lastBarIndex] <= movingAverage3.Result[lastBarIndex] sell = rsi.Result[lastBarIndex] >= Overbought && rsi.Result[prevBarIndex] <= Overbought && greenCandlePower <= MaxCandlePower && redCandlePower >= greenCandlePower && MarketSeries.Close[lastBarIndex] >= movingAverage3.Result[lastBarIndex]
16. RSI_Con_MA1MA2
Buy: RSI latest ≤ oversold & RSI prev ≥ oversold & closing ≥ MA1 & closing ≥ MA2
Sell: RSI latest ≥ overbought & RSI prev ≤ overbought & closing ≤ MA1 & closing ≤ MA2
buy = rsi.Result[lastBarIndex] <= Oversold && rsi.Result[prevBarIndex] >= Oversold && MarketSeries.Close[lastBarIndex] >= ma1Current && MarketSeries.Close[lastBarIndex] >= ma2Current
sell = rsi.Result[lastBarIndex] >= Overbought && rsi.Result[prevBarIndex] <= Overbought && MarketSeries.Close[lastBarIndex] <= ma1Current && MarketSeries.Close[lastBarIndex] <= ma2Current
17. RSI_CPC_MA1MA2
Buy: RSI latest ≤ oversold & red candle ≤ Max & green candle ≥ average & closing ≥ MA1 & closing ≥ MA2
Sell: RSI latest ≥ overbought & green candle ≤ Max & red candle ≥ average & closing ≤ MA1 & closing ≤ MA2
buy = rsi.Result[lastBarIndex] <= Oversold && redCandlePower <= MaxCandlePower && greenCandlePower >= averagePower && MarketSeries.Close[lastBarIndex] >= ma1Current && MarketSeries.Close[lastBarIndex] >= ma2Current
sell = rsi.Result[lastBarIndex] >= Overbought && greenCandlePower <= MaxCandlePower && redCandlePower >= averagePower && MarketSeries.Close[lastBarIndex] <= ma1Current && MarketSeries.Close[lastBarIndex] <= ma2Current
18. RSI_Con_MA1MA2_MA3
Buy: RSI latest ≤ oversold & RSI prev ≥ oversold & closing ≥ MA1 & closing ≥ MA2 & closing ≥ MA3
Sell: RSI latest ≥ overbought & RSI prev ≤ overbought & closing ≤ MA1 & closing ≤ MA2 & closing ≤ MA3
buy = rsi.Result[lastBarIndex] <= Oversold && rsi.Result[prevBarIndex] >= Oversold &&
      MarketSeries.Close[lastBarIndex] >= ma1Current && MarketSeries.Close[lastBarIndex] >= ma2Current &&
      MarketSeries.Close[lastBarIndex] >= movingAverage3.Result[lastBarIndex]

sell = rsi.Result[lastBarIndex] >= Overbought && rsi.Result[prevBarIndex] <= Overbought &&
       MarketSeries.Close[lastBarIndex] <= ma1Current && MarketSeries.Close[lastBarIndex] <= ma2Current &&
       MarketSeries.Close[lastBarIndex] <= movingAverage3.Result[lastBarIndex]
19. RSI_Con_MA1MA2_MA3Nega
Buy: RSI latest ≤ oversold & RSI prev ≥ oversold & closing ≥ MA1 & closing ≥ MA2 & closing ≤ MA3
Sell: RSI latest ≥ overbought & RSI prev ≤ overbought & closing ≤ MA1 & closing ≤ MA2 & closing ≥ MA3
buy = rsi.Result[lastBarIndex] <= Oversold && rsi.Result[prevBarIndex] >= Oversold &&
      MarketSeries.Close[lastBarIndex] >= ma1Current && MarketSeries.Close[lastBarIndex] >= ma2Current &&
      MarketSeries.Close[lastBarIndex] <= movingAverage3.Result[lastBarIndex] sell = rsi.Result[lastBarIndex] >= Overbought && rsi.Result[prevBarIndex] <= Overbought &&
       MarketSeries.Close[lastBarIndex] <= ma1Current && MarketSeries.Close[lastBarIndex] <= ma2Current && MarketSeries.Close[lastBarIndex] >= movingAverage3.Result[lastBarIndex]
20. RSI_CPC_MA1MA2_MA3
Buy: RSI latest ≤ oversold & red candle ≤ Max & green candle ≥ average & closing ≥ MA1 & closing ≥ MA2 & closing ≥ MA3
Sell: RSI latest ≥ overbought & green candle ≤ Max & red candle ≥ average & closing ≤ MA1 & closing ≤ MA2 & closing ≤ MA3
buy = rsi.Result[lastBarIndex] <= Oversold && redCandlePower <= MaxCandlePower && greenCandlePower >= averagePower &&
      MarketSeries.Close[lastBarIndex] >= ma1Current && MarketSeries.Close[lastBarIndex] >= ma2Current &&
      MarketSeries.Close[lastBarIndex] >= movingAverage3.Result[lastBarIndex]

sell = rsi.Result[lastBarIndex] >= Overbought && greenCandlePower <= MaxCandlePower && redCandlePower >= averagePower &&
       MarketSeries.Close[lastBarIndex] <= ma1Current && MarketSeries.Close[lastBarIndex] <= ma2Current &&
       MarketSeries.Close[lastBarIndex] <= movingAverage3.Result[lastBarIndex]
21. RSI_CPC_MA1MA2_MA3Nega
Buy: RSI latest ≤ oversold & red candle ≤ Max & green candle ≥ average & closing ≥ MA1 & closing ≥ MA2 & closing ≤ MA3
Sell: RSI latest ≥ overbought & green candle ≤ Max & red candle ≥ average & closing ≤ MA1 & closing ≤ MA2 & closing ≥ MA3
buy = rsi.Result[lastBarIndex] <= Oversold && redCandlePower <= MaxCandlePower && greenCandlePower >= averagePower &&
      MarketSeries.Close[lastBarIndex] >= ma1Current && MarketSeries.Close[lastBarIndex] >= ma2Current &&
      MarketSeries.Close[lastBarIndex] <= movingAverage3.Result[lastBarIndex] sell = rsi.Result[lastBarIndex] >= Overbought && greenCandlePower <= MaxCandlePower && redCandlePower >= averagePower &&
       MarketSeries.Close[lastBarIndex] <= ma1Current && MarketSeries.Close[lastBarIndex] <= ma2Current && MarketSeries.Close[lastBarIndex] >= movingAverage3.Result[lastBarIndex]
22. RSI_Con_CPC_MA1MA2_MA3
Buy: RSI latest ≤ oversold & RSI prev ≥ oversold & red candle ≤ Max & green candle ≥ red candle & closing ≥ MA1 & closing ≥ MA2 & closing ≥ MA3
Sell: RSI latest ≥ overbought & RSI prev ≤ overbought & green candle ≤ Max & red candle ≥ green candle & closing ≤ MA1 & closing ≤ MA2 & closing ≤ MA3
buy = rsi.Result[lastBarIndex] <= Oversold && rsi.Result[prevBarIndex] >= Oversold &&
      redCandlePower <= MaxCandlePower && greenCandlePower >= redCandlePower &&
      MarketSeries.Close[lastBarIndex] >= ma1Current && MarketSeries.Close[lastBarIndex] >= ma2Current &&
      MarketSeries.Close[lastBarIndex] >= movingAverage3.Result[lastBarIndex]

sell = rsi.Result[lastBarIndex] >= Overbought && rsi.Result[prevBarIndex] <= Overbought &&
       greenCandlePower <= MaxCandlePower && redCandlePower >= greenCandlePower &&
       MarketSeries.Close[lastBarIndex] <= ma1Current && MarketSeries.Close[lastBarIndex] <= ma2Current &&
       MarketSeries.Close[lastBarIndex] <= movingAverage3.Result[lastBarIndex]
23. RSI_Con_CPC_MA1MA2_MA3Nega
Buy: RSI latest ≤ oversold & RSI prev ≥ oversold & red candle ≤ Max & green candle ≥ red candle & closing ≥ MA1 & closing ≥ MA2 & closing ≤ MA3
Sell: RSI latest ≥ overbought & RSI prev ≤ overbought & green candle ≤ Max & red candle ≥ green candle & closing ≤ MA1 & closing ≤ MA2 & closing ≥ MA3
buy = rsi.Result[lastBarIndex] <= Oversold && rsi.Result[prevBarIndex] >= Oversold &&
      redCandlePower <= MaxCandlePower && greenCandlePower >= redCandlePower &&
      MarketSeries.Close[lastBarIndex] >= ma1Current && MarketSeries.Close[lastBarIndex] >= ma2Current &&
      MarketSeries.Close[lastBarIndex] <= movingAverage3.Result[lastBarIndex] sell = rsi.Result[lastBarIndex] >= Overbought && rsi.Result[prevBarIndex] <= Overbought &&
       greenCandlePower <= MaxCandlePower && redCandlePower >= greenCandlePower &&
       MarketSeries.Close[lastBarIndex] <= ma1Current && MarketSeries.Close[lastBarIndex] <= ma2Current && MarketSeries.Close[lastBarIndex] >= movingAverage3.Result[lastBarIndex]
24. MA1MA2 Cross
Buy: When MA1 crosses above MA2
Sell: When MA1 crosses below MA2
buy = ma1Previous <= ma2Previous && ma1Current > ma2Current
sell = ma1Previous >= ma2Previous && ma1Current < ma2Current
25. MA1MA2_CPC
Buy: MA1 crosses above MA2 & red candle ≤ Max & green candle ≥ red candle
Sell: MA1 crosses below MA2 & green candle ≤ Max & red candle ≥ green candle
buy = ma1Previous <= ma2Previous && ma1Current > ma2Current && redCandlePower <= MaxCandlePower && greenCandlePower >= redCandlePower
sell = ma1Previous >= ma2Previous && ma1Current < ma2Current && greenCandlePower <= MaxCandlePower && redCandlePower >= greenCandlePower
26. MA1MA2_CPC
Buy: MA1 crosses above MA2 & red candle ≤ Max & green candle ≥ red candle
Sell: MA1 crosses below MA2 & green candle ≤ Max & red candle ≥ green candle
buy = ma1Previous <= ma2Previous && ma1Current > ma2Current &&
      redCandlePower <= MaxCandlePower && greenCandlePower >= redCandlePower

sell = ma1Previous >= ma2Previous && ma1Current < ma2Current &&
       greenCandlePower <= MaxCandlePower && redCandlePower >= greenCandlePower
27. MA1MA2_RSIFilter
Buy: MA1 crosses above MA2 & RSI < Overbought
Sell: MA1 crosses below MA2 & RSI > Oversold
buy = ma1Previous <= ma2Previous && ma1Current > ma2Current && rsi.Result[lastBarIndex] < Overbought sell = ma1Previous >= ma2Previous && ma1Current < ma2Current && rsi.Result[lastBarIndex] > Oversold
28. MA1MA2_RSIFilter_CPC
Buy: MA1 crosses above MA2 & RSI < Overbought & red candle ≤ Max & green candle ≥ red candle
Sell: MA1 crosses below MA2 & RSI > Oversold & green candle ≤ Max & red candle ≥ green candle
buy = ma1Previous <= ma2Previous && ma1Current > ma2Current && rsi.Result[lastBarIndex] < Overbought &&
      redCandlePower <= MaxCandlePower && greenCandlePower >= redCandlePower

sell = ma1Previous >= ma2Previous && ma1Current < ma2Current && rsi.Result[lastBarIndex] > Oversold &&
       greenCandlePower <= MaxCandlePower && redCandlePower >= greenCandlePower
29. MA1MA2_MA3_RSIFilter
Buy: MA1 crosses above MA2 & price ≥ MA3 & RSI < Overbought
Sell: MA1 crosses below MA2 & price ≤ MA3 & RSI > Oversold
buy = ma1Previous <= ma2Previous && ma1Current > ma2Current &&
      MarketSeries.Close[lastBarIndex] >= movingAverage3.Result[lastBarIndex] &&
      rsi.Result[lastBarIndex] < Overbought sell = ma1Previous >= ma2Previous && ma1Current < ma2Current  &&
       MarketSeries.Close[lastBarIndex] <= movingAverage3.Result[lastBarIndex] && rsi.Result[lastBarIndex] > Oversold
30. MA1MA2_MA3Nega_RSIFilter
Buy: MA1 crosses above MA2 & price ≤ MA3 & RSI < Overbought
Sell: MA1 crosses below MA2 & price ≥ MA3 & RSI > Oversold
buy = ma1Previous <= ma2Previous && ma1Current > ma2Current &&
      MarketSeries.Close[lastBarIndex] <= movingAverage3.Result[lastBarIndex] &&
      rsi.Result[lastBarIndex] < Overbought sell = ma1Previous >= ma2Previous && ma1Current < ma2Current && MarketSeries.Close[lastBarIndex] >= movingAverage3.Result[lastBarIndex] &&
       rsi.Result[lastBarIndex] > Oversold
31. MA1MA2_MA3_RSIFilter_CPC
Buy: MA1 crosses above MA2 & price ≥ MA3 & RSI < Overbought & red candle ≤ Max & green candle ≥ red candle
Sell: MA1 crosses below MA2 & price ≤ MA3 & RSI > Oversold & green candle ≤ Max & red candle ≥ green candle
buy = ma1Previous <= ma2Previous && ma1Current > ma2Current &&
      MarketSeries.Close[lastBarIndex] >= movingAverage3.Result[lastBarIndex] &&
      rsi.Result[lastBarIndex] < Overbought &&
      redCandlePower <= MaxCandlePower && greenCandlePower >= redCandlePower

sell = ma1Previous >= ma2Previous && ma1Current < ma2Current  &&
       MarketSeries.Close[lastBarIndex] <= movingAverage3.Result[lastBarIndex] && rsi.Result[lastBarIndex] > Oversold &&
       greenCandlePower <= MaxCandlePower && redCandlePower >= greenCandlePower
31. MA1MA2_MA3Nega_RSIFilter_CPC
Buy: MA1 crosses above MA2 & price ≤ MA3 & RSI < Overbought & red candle ≤ Max & green candle ≥ red candle
Sell: MA1 crosses below MA2 & price ≥ MA3 & RSI > Oversold & green candle ≤ Max & red candle ≥ green candle
buy = ma1Previous <= ma2Previous && ma1Current > ma2Current &&
      MarketSeries.Close[lastBarIndex] <= movingAverage3.Result[lastBarIndex] &&
      rsi.Result[lastBarIndex] < Overbought &&
      redCandlePower <= MaxCandlePower && greenCandlePower >= redCandlePower

sell = ma1Previous >= ma2Previous && ma1Current < ma2Current && MarketSeries.Close[lastBarIndex] >= movingAverage3.Result[lastBarIndex] &&
       rsi.Result[lastBarIndex] > Oversold &&
       greenCandlePower <= MaxCandlePower && redCandlePower >= greenCandlePower

Reviews
There are no reviews yet.