DRKHASHIX AI Rommel Strategy Builder

DRKHASHIX AI Rommel Strategy Builder is an advanced automated trading robot that utilizes complex algorithms and artificial intelligence to assist you in making intelligent and efficient trades in financial markets. This is not just a robot; it’s more of a strategy builder, allowing you to create any trading strategy you desire.
Advanced Artificial Intelligence
This robot employs AI algorithms for market analysis and trade decision-making. Its precise coordination with price changes makes it an efficient tool for achieving sustainable profitability.
Signal Selection
Trading signals are just part of the process; it’s the algorithms that ensure your success. This robot offers various methods to receive trading signals. You can easily select the appropriate signal type with a simple click or activate manual mode to open trades yourself, while the robot manages the positions.
Smart Manual Trading
With buy, sell, and close buttons, you can easily open or close trades manually. This feature is ideal for those who prefer to execute their trades personally, with the robot acting more as an assistant to ensure your decisions are implemented optimally.
Intelligent Risk Management
This robot helps you effectively manage trade risks. For instance, you can set it to ensure that a maximum of 2% of your capital is at risk in each trade. In this case, the AI sets your stop-loss and selects a trade volume so that if the stop-loss is activated, your account only incurs a 2% loss.
Protection from Forbidden Trading Times
With this feature, the robot prevents trading during unauthorized times that you have previously set, helping to avoid trading at inappropriate moments.
Detailed Performance Reports
The DRKHASHIX AI Rommel Strategy Builder provides detailed and comprehensive reports on trading performance, allowing you to evaluate and improve your strategies.
Risk-Free Trading
This robot uses AI to make your trades risk-free; as the price moves in your favor, the stop-loss adjusts in your favor to ensure your profit is secured at the best possible point.
Trade Closing Using Moving Averages (MA)
This feature uses two moving averages to analyze open trades. If a trade reaches a specified profit level and the averages cross each other, the robot will close the trade before reaching the take profit (TP), ensuring a secure exit.
Advanced Risk Management with a New Martingale Method
While this robot does not use the traditional Martingale method, it offers a novel way to adjust trade risks. If a trade encounters a stop-loss, the robot increases the risk of subsequent trades to recover losses and then gradually decreases the risk. This feature is at your discretion, allowing you to enable or disable it.
Differences Between Rommel and Guderian Robots

1. Type of Trades:
Rommel Robot: This robot operates on a single trade basis, focusing primarily on analyzing trading signals and determining risk size for selecting volume and setting stop-loss.
Guderian Robot: This robot focuses on stair-step entry volumes and averaging down to escape losses, as well as opening reverse trades in a stair-step manner.
2. Risk Management:
Rommel Robot: With precise calculations, it helps you effectively manage risk and select trade volumes according to the specified risk level.
Guderian Robot: It may not perform as well as Rommel in risk management, as its algorithm automatically attempts to turn every trade into a profit.
3. Flexibility in Strategies:
Rommel Robot: Its simplicity and focus on trading signals allow you to easily test and analyze various trading signals.
Guderian Robot: Although it has advanced capital management, setting strategies in this robot may be somewhat more complex.
4. Applications and Benefits:
Rommel Robot: It demonstrates its advantages in precise analysis and the creation of clear trading signals, making it suitable for traders with more defined, simpler, and general strategies.
Guderian Robot: While you may need Rommel to obtain parameters for more suitable signals, its specific complexities allow for the implementation of more intricate strategies.
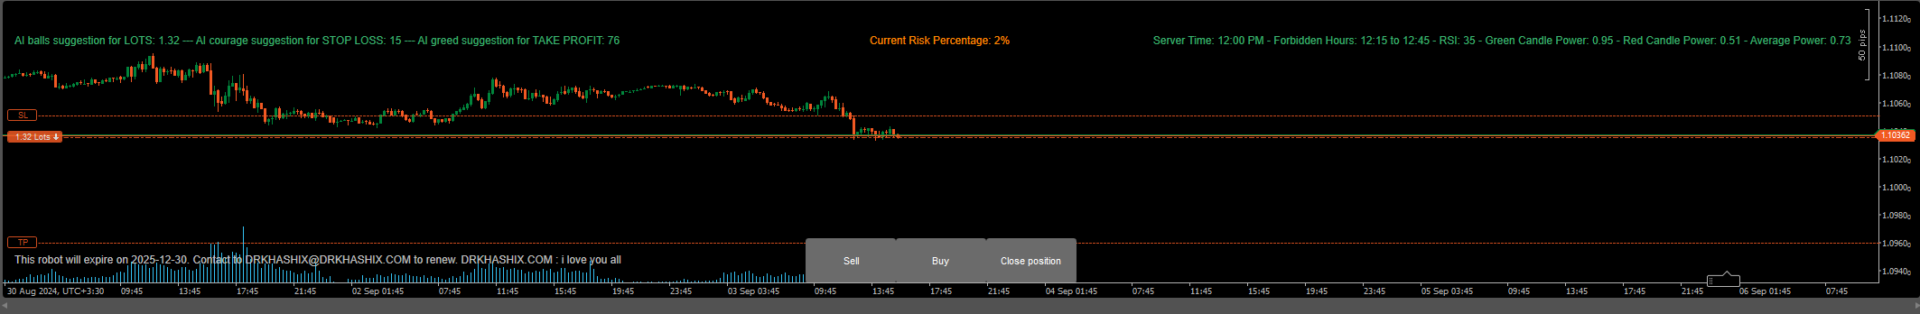
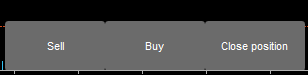
In manual trading mode, the bot features a trading dashboard that allows you to execute actions by pressing the designated button.
AI Signal Settings
Tradesignal
This parameter is used to select the type of signaling method. Here, we can choose which type of signals to use. We have over 30 different signal combinations, and by selecting any of them, the trading bot will execute the signals based on that specific method.
RSI Signal Period
This parameter is used to select the RSI period.
RSI Threshold – 50 -+ 20 = 70-30
This parameter is used to define the overbought and oversold levels of the RSI. By default, it is set at 50. If adjusted to 20, 20 units will be added to the overbought level, bringing it to 70, and 20 units will also be added to the oversold level, bringing it to 30.
MA 1 (MA2 = MA1 X 2)
This parameter is used to calculate Moving Average 1 (MA1) and Moving Average 2 (MA2). Any value selected for this parameter becomes the value for MA1, while MA2 is automatically set as double the value of MA1.
MA 3 trend
This parameter is used to set the period for Moving Average 3.
Candle Power Period Reference
This parameter sets the period for analyzing the total number of candles, assessing the strength of the candles within the specified period.
Candle Power Period To Check
This parameter compares the recent number of candles with the Candle Power Period Reference to assess the strength of the candles.
Max Candle Power
Max Candle Power calculates the candle strength obtained from the Candle Power Period Reference in relation to the Candle Power Period To Check. This strength is then used in trading signals to determine whether to allow trade openings.
AI Risk Management Calculator
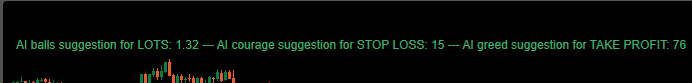
- AI balls (Risk): This parameter intelligently defines the risk level, determining the amount of volume to use so that if your stop-loss is triggered, your account will only incur that specified amount of loss.
- AI Periods: This parameter defines the AI period, specifying how many candles to analyze in order to determine your stop-loss value and the appropriate volume.
- AI courage (Stop loss): This parameter sets the risk level for the AI in determining your stop-loss. The larger the number, the more the bot will opt for lower-risk stop-loss levels.
- AI Greed (Take Profit): This parameter defines the greed level of the AI. The larger the number entered in this parameter, the more the bot will aim for higher profit targets.
At the top left of the page, the stop-loss, take profit, and lot size are always displayed, indicating the values that would apply if a trade were to be opened at that moment.
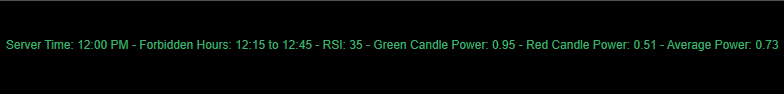
Other necessary information is always displayed on the top right of the chart.
Position Risk Free
- Enable risk free: If this option is enabled, the bot will implement risk-free trading based on AI to adjust the stop-loss to the optimal position for profit.
- risk free start pip: This parameter determines when the risk-free trading feature begins to operate.
- AI Period for risk free: As mentioned, the bot uses AI to adjust the stop-loss towards profit. To facilitate this, we need to determine how many candles the AI should analyze.
- AI Multiplier for riskfree: Similar to the AI Courage parameter, this parameter defines the bot’s risk level for adjusting the stop-loss.
How Risk Free Works
Closing Position in Profit with MA
- Close Position MA: This parameter determines whether we exit trades when two moving averages cross while we are in profit or not.
- Close Position MA start USD: This parameter specifies the dollar amount of profit at which we exit a trade when the moving averages cross.
- MA 1 (MA2 = MA1 X 2): This parameter refers to Moving Averages 1 and 2, specifying that whenever the two moving averages cross, we exit the trade.
Forbidden Hours Start – End GMT 0
- These two parameters are used to specify the times during which the bot is not allowed to open trades.
- The times are based on GMT (Greenwich Mean Time), which is a global reference for time determination.
Martingale
- Use Martingale high risk: This parameter allows you to choose whether to increase risk using the Martingale method.
- Increase RiskPercentage: This parameter determines how much to increase the risk for the next trade if the previous trade was a loss.
- Decrease RiskPercentage: This parameter determines how much to decrease the risk for the next trade if the previous trade was a win.
- Martingale Start After Losses: In this parameter, you can specify after how many losses the bot should start increasing the risk.
- Consecutive Win Count: In this parameter, you can specify how many consecutive wins should trigger the bot to revert to the initial risk level.
To ensure you are not confused, the bot constantly displays the current risk level at the top of the page.
1. Manual
Buy: A buy signal is triggered when the buy button is pressed.
Sell: A sell signal is triggered when the sell button is pressed.
buy = buyButtonPressed
sell = sellButtonPressed
2. Cazino
Buy: Closing price of the latest candle is higher than its opening, and the previous candle closes higher than it opens.
Sell: Closing price of the latest candle is lower than its opening, and the previous candle closes lower than it opens.
buy = MarketSeries.Close[lastBarIndex] > MarketSeries.Open[lastBarIndex] && MarketSeries.Close[prevBarIndex] > MarketSeries.Open[prevBarIndex]
sell = MarketSeries.Close[lastBarIndex] < MarketSeries.Open[lastBarIndex] && MarketSeries.Close[prevBarIndex] < MarketSeries.Open[prevBarIndex]
3. CPC
Buy: Red candle power ≤ MaxCandlePower, green candle power ≥ red candle power, and RSI below overbought.
Sell: Green candle power ≤ MaxCandlePower, red candle power ≥ green candle power, and RSI above oversold.
buy = redCandlePower <= MaxCandlePower && greenCandlePower >= redCandlePower && rsi.Result[lastBarIndex] < Overbought
sell = greenCandlePower <= MaxCandlePower && redCandlePower >= greenCandlePower && rsi.Result[lastBarIndex] > Oversold
4. CPC_RSIfilter
Buy: Red candle power ≤ MaxCandlePower, green candle power ≥ red candle power, and RSI below overbought.
Sell: Green candle power ≤ MaxCandlePower, red candle power ≥ green candle power, and RSI above oversold.
buy = redCandlePower <= MaxCandlePower && greenCandlePower >= redCandlePower && rsi.Result[lastBarIndex] < Overbought
sell = greenCandlePower <= MaxCandlePower && redCandlePower >= greenCandlePower && rsi.Result[lastBarIndex] > Oversold
CPC_RSIfilter_MA3
Buy: Red candle power ≤ MaxCandlePower, green candle power ≥ red candle power, RSI < overbought, and closing price ≥ 3rd moving average.
Sell: Green candle power ≤ MaxCandlePower, red candle power ≥ green candle power, RSI > oversold, and closing price ≤ 3rd moving average.
buy = redCandlePower <= MaxCandlePower && greenCandlePower >= redCandlePower && rsi.Result[lastBarIndex] < Overbought && MarketSeries.Close[lastBarIndex] >= movingAverage3.Result[lastBarIndex]
sell = greenCandlePower <= MaxCandlePower && redCandlePower >= greenCandlePower && rsi.Result[lastBarIndex] > Oversold && MarketSeries.Close[lastBarIndex] <= movingAverage3.Result[lastBarIndex]
5. CPC_RSIfilter_MA3Nega
Buy: Red candle power ≤ MaxCandlePower, green candle power ≥ red candle power, RSI < overbought, closing price ≤ 3rd moving average.
Sell: Green candle power ≤ MaxCandlePower, red candle power ≥ green candle power, RSI > oversold, closing price ≥ 3rd moving average.
buy = redCandlePower <= MaxCandlePower && greenCandlePower >= redCandlePower && rsi.Result[lastBarIndex] < Overbought && MarketSeries.Close[lastBarIndex] <= movingAverage3.Result[lastBarIndex]
sell = greenCandlePower <= MaxCandlePower && redCandlePower >= greenCandlePower && rsi.Result[lastBarIndex] > Oversold && MarketSeries.Close[lastBarIndex] >= movingAverage3.Result[lastBarIndex]
6. RSI
Buy: RSI ≤ oversold
Sell: RSI ≥ overbought
buy = rsi.Result[lastBarIndex] <= Oversold sell = rsi.Result[lastBarIndex] >= Overbought
7. RSI_Con
Buy: RSI latest ≤ oversold & RSI previous ≥ oversold
Sell: RSI latest ≥ overbought & RSI previous ≤ overbought
buy = rsi.Result[lastBarIndex] <= Oversold && rsi.Result[prevBarIndex] >= Oversold
sell = rsi.Result[lastBarIndex] >= Overbought && rsi.Result[prevBarIndex] <= Overbought
8. RSI_CPC
Buy: RSI ≤ oversold & red candle power ≤ MaxCandlePower & green candle power ≥ red candle power
Sell: RSI ≥ overbought & green candle power ≤ MaxCandlePower & red candle power ≥ green candle power
buy = rsi.Result[lastBarIndex] <= Oversold  && redCandlePower <= MaxCandlePower && greenCandlePower >= redCandlePower
sell= rsi.Result[lastBarIndex] >= Overbought && greenCandlePower <= MaxCandlePower && redCandlePower >= greenCandlePower
9. RSI_Con_CPC
Buy: RSI latest ≤ oversold & RSI previous ≥ oversold & red candle power ≤ MaxCandlePower & green candle power ≥ red candle power
Sell: RSI latest ≥ overbought & RSI previous ≤ overbought & green candle power ≤ MaxCandlePower & red candle power ≥ green candle power
buy = rsi.Result[lastBarIndex] <= Oversold && rsi.Result[prevBarIndex] >= Oversold && redCandlePower <= MaxCandlePower && greenCandlePower >= redCandlePower
sell = rsi.Result[lastBarIndex] >= Overbought && rsi.Result[prevBarIndex] <= Overbought && greenCandlePower <= MaxCandlePower && redCandlePower >= greenCandlePower
10. RSI_Con_MA3
Buy: RSI latest ≤ oversold & RSI previous ≥ oversold & closing price ≥ 3rd MA
Sell: RSI latest ≥ overbought & RSI previous ≤ overbought & closing price ≤ 3rd MA
buy = rsi.Result[lastBarIndex] <= Oversold && rsi.Result[prevBarIndex] >= Oversold && MarketSeries.Close[lastBarIndex] >= movingAverage3.Result[lastBarIndex]
sell = rsi.Result[lastBarIndex] >= Overbought && rsi.Result[prevBarIndex] <= Overbought && MarketSeries.Close[lastBarIndex] <= movingAverage3.Result[lastBarIndex]
11. RSI_Con_MA3Nega
Buy: RSI latest ≤ oversold & RSI previous ≥ oversold & closing price ≤ 3rd MA
Sell: RSI latest ≥ overbought & RSI previous ≤ overbought & closing price ≥ 3rd MA
buy = rsi.Result[lastBarIndex] <= Oversold && rsi.Result[prevBarIndex] >= Oversold && MarketSeries.Close[lastBarIndex] <= movingAverage3.Result[lastBarIndex] sell = rsi.Result[lastBarIndex] >= Overbought && rsi.Result[prevBarIndex] <= Overbought && MarketSeries.Close[lastBarIndex] >= movingAverage3.Result[lastBarIndex]
12. RSI_CPC_MA3
Buy: RSI latest ≤ oversold & red candle ≤ Max & green candle ≥ red candle & closing ≥ 3rd MA
Sell: RSI latest ≥ overbought & green candle ≤ Max & red candle ≥ green candle & closing ≤ 3rd MA
buy = rsi.Result[lastBarIndex] <= Oversold && redCandlePower <= MaxCandlePower && greenCandlePower >= redCandlePower && MarketSeries.Close[lastBarIndex] >= movingAverage3.Result[lastBarIndex]
sell = rsi.Result[lastBarIndex] >= Overbought && greenCandlePower <= MaxCandlePower && redCandlePower >= greenCandlePower && MarketSeries.Close[lastBarIndex] <= movingAverage3.Result[lastBarIndex]
13. RSI_CPC_MA3Nega
Buy: RSI latest ≤ oversold & red candle ≤ Max & green candle ≥ red candle & closing ≤ 3rd MA
Sell: RSI latest ≥ overbought & green candle ≤ Max & red candle ≥ green candle & closing ≥ 3rd MA
buy = rsi.Result[lastBarIndex] <= Oversold && redCandlePower <= MaxCandlePower && greenCandlePower >= redCandlePower && MarketSeries.Close[lastBarIndex] <= movingAverage3.Result[lastBarIndex] sell = rsi.Result[lastBarIndex] >= Overbought && greenCandlePower <= MaxCandlePower && redCandlePower >= greenCandlePower && MarketSeries.Close[lastBarIndex] >= movingAverage3.Result[lastBarIndex]
14. RSI_Con_CPC_MA3
Buy: RSI latest ≤ oversold & RSI prev ≥ oversold & red candle ≤ Max & green candle ≥ red candle & closing ≥ 3rd MA
Sell: RSI latest ≥ overbought & RSI prev ≤ overbought & green candle ≤ Max & red candle ≥ green candle & closing ≤ 3rd MA
buy = rsi.Result[lastBarIndex] <= Oversold && rsi.Result[prevBarIndex] >= Oversold  && redCandlePower <= MaxCandlePower && greenCandlePower >= redCandlePower && MarketSeries.Close[lastBarIndex] >= movingAverage3.Result[lastBarIndex]
sell = rsi.Result[lastBarIndex] >= Overbought && rsi.Result[prevBarIndex] <= Overbought && greenCandlePower <= MaxCandlePower && redCandlePower >= greenCandlePower && MarketSeries.Close[lastBarIndex]  <= movingAverage3.Result[lastBarIndex]
15. RSI_Con_CPC_MA3Nega
Buy: RSI latest ≤ oversold & RSI prev ≥ oversold & red candle ≤ Max & green candle ≥ red candle & closing ≤ 3rd MA
Sell: RSI latest ≥ overbought & RSI prev ≤ overbought & green candle ≤ Max & red candle ≥ green candle & closing ≥ 3rd MA
buy = rsi.Result[lastBarIndex] <= Oversold && rsi.Result[prevBarIndex] >= Oversold && redCandlePower <= MaxCandlePower && greenCandlePower >= redCandlePower && MarketSeries.Close[lastBarIndex] <= movingAverage3.Result[lastBarIndex] sell = rsi.Result[lastBarIndex] >= Overbought && rsi.Result[prevBarIndex] <= Overbought && greenCandlePower <= MaxCandlePower && redCandlePower >= greenCandlePower && MarketSeries.Close[lastBarIndex] >= movingAverage3.Result[lastBarIndex]
16. RSI_Con_MA1MA2
Buy: RSI latest ≤ oversold & RSI prev ≥ oversold & closing ≥ MA1 & closing ≥ MA2
Sell: RSI latest ≥ overbought & RSI prev ≤ overbought & closing ≤ MA1 & closing ≤ MA2
buy = rsi.Result[lastBarIndex] <= Oversold && rsi.Result[prevBarIndex] >= Oversold && MarketSeries.Close[lastBarIndex] >= ma1Current && MarketSeries.Close[lastBarIndex] >= ma2Current
sell = rsi.Result[lastBarIndex] >= Overbought && rsi.Result[prevBarIndex] <= Overbought && MarketSeries.Close[lastBarIndex] <= ma1Current && MarketSeries.Close[lastBarIndex] <= ma2Current
17. RSI_CPC_MA1MA2
Buy: RSI latest ≤ oversold & red candle ≤ Max & green candle ≥ average & closing ≥ MA1 & closing ≥ MA2
Sell: RSI latest ≥ overbought & green candle ≤ Max & red candle ≥ average & closing ≤ MA1 & closing ≤ MA2
buy = rsi.Result[lastBarIndex] <= Oversold && redCandlePower <= MaxCandlePower && greenCandlePower >= averagePower && MarketSeries.Close[lastBarIndex] >= ma1Current && MarketSeries.Close[lastBarIndex] >= ma2Current
sell = rsi.Result[lastBarIndex] >= Overbought && greenCandlePower <= MaxCandlePower && redCandlePower >= averagePower && MarketSeries.Close[lastBarIndex] <= ma1Current && MarketSeries.Close[lastBarIndex] <= ma2Current
18. RSI_Con_MA1MA2_MA3
Buy: RSI latest ≤ oversold & RSI prev ≥ oversold & closing ≥ MA1 & closing ≥ MA2 & closing ≥ MA3
Sell: RSI latest ≥ overbought & RSI prev ≤ overbought & closing ≤ MA1 & closing ≤ MA2 & closing ≤ MA3
buy = rsi.Result[lastBarIndex] <= Oversold && rsi.Result[prevBarIndex] >= Oversold &&
      MarketSeries.Close[lastBarIndex] >= ma1Current && MarketSeries.Close[lastBarIndex] >= ma2Current &&
      MarketSeries.Close[lastBarIndex] >= movingAverage3.Result[lastBarIndex]

sell = rsi.Result[lastBarIndex] >= Overbought && rsi.Result[prevBarIndex] <= Overbought &&
       MarketSeries.Close[lastBarIndex] <= ma1Current && MarketSeries.Close[lastBarIndex] <= ma2Current &&
       MarketSeries.Close[lastBarIndex] <= movingAverage3.Result[lastBarIndex]
19. RSI_Con_MA1MA2_MA3Nega
Buy: RSI latest ≤ oversold & RSI prev ≥ oversold & closing ≥ MA1 & closing ≥ MA2 & closing ≤ MA3
Sell: RSI latest ≥ overbought & RSI prev ≤ overbought & closing ≤ MA1 & closing ≤ MA2 & closing ≥ MA3
buy = rsi.Result[lastBarIndex] <= Oversold && rsi.Result[prevBarIndex] >= Oversold &&
      MarketSeries.Close[lastBarIndex] >= ma1Current && MarketSeries.Close[lastBarIndex] >= ma2Current &&
      MarketSeries.Close[lastBarIndex] <= movingAverage3.Result[lastBarIndex] sell = rsi.Result[lastBarIndex] >= Overbought && rsi.Result[prevBarIndex] <= Overbought &&
       MarketSeries.Close[lastBarIndex] <= ma1Current && MarketSeries.Close[lastBarIndex] <= ma2Current && MarketSeries.Close[lastBarIndex] >= movingAverage3.Result[lastBarIndex]
20. RSI_CPC_MA1MA2_MA3
Buy: RSI latest ≤ oversold & red candle ≤ Max & green candle ≥ average & closing ≥ MA1 & closing ≥ MA2 & closing ≥ MA3
Sell: RSI latest ≥ overbought & green candle ≤ Max & red candle ≥ average & closing ≤ MA1 & closing ≤ MA2 & closing ≤ MA3
buy = rsi.Result[lastBarIndex] <= Oversold && redCandlePower <= MaxCandlePower && greenCandlePower >= averagePower &&
      MarketSeries.Close[lastBarIndex] >= ma1Current && MarketSeries.Close[lastBarIndex] >= ma2Current &&
      MarketSeries.Close[lastBarIndex] >= movingAverage3.Result[lastBarIndex]

sell = rsi.Result[lastBarIndex] >= Overbought && greenCandlePower <= MaxCandlePower && redCandlePower >= averagePower &&
       MarketSeries.Close[lastBarIndex] <= ma1Current && MarketSeries.Close[lastBarIndex] <= ma2Current &&
       MarketSeries.Close[lastBarIndex] <= movingAverage3.Result[lastBarIndex]
21. RSI_CPC_MA1MA2_MA3Nega
Buy: RSI latest ≤ oversold & red candle ≤ Max & green candle ≥ average & closing ≥ MA1 & closing ≥ MA2 & closing ≤ MA3
Sell: RSI latest ≥ overbought & green candle ≤ Max & red candle ≥ average & closing ≤ MA1 & closing ≤ MA2 & closing ≥ MA3
buy = rsi.Result[lastBarIndex] <= Oversold && redCandlePower <= MaxCandlePower && greenCandlePower >= averagePower &&
      MarketSeries.Close[lastBarIndex] >= ma1Current && MarketSeries.Close[lastBarIndex] >= ma2Current &&
      MarketSeries.Close[lastBarIndex] <= movingAverage3.Result[lastBarIndex] sell = rsi.Result[lastBarIndex] >= Overbought && greenCandlePower <= MaxCandlePower && redCandlePower >= averagePower &&
       MarketSeries.Close[lastBarIndex] <= ma1Current && MarketSeries.Close[lastBarIndex] <= ma2Current && MarketSeries.Close[lastBarIndex] >= movingAverage3.Result[lastBarIndex]
22. RSI_Con_CPC_MA1MA2_MA3
Buy: RSI latest ≤ oversold & RSI prev ≥ oversold & red candle ≤ Max & green candle ≥ red candle & closing ≥ MA1 & closing ≥ MA2 & closing ≥ MA3
Sell: RSI latest ≥ overbought & RSI prev ≤ overbought & green candle ≤ Max & red candle ≥ green candle & closing ≤ MA1 & closing ≤ MA2 & closing ≤ MA3
buy = rsi.Result[lastBarIndex] <= Oversold && rsi.Result[prevBarIndex] >= Oversold &&
      redCandlePower <= MaxCandlePower && greenCandlePower >= redCandlePower &&
      MarketSeries.Close[lastBarIndex] >= ma1Current && MarketSeries.Close[lastBarIndex] >= ma2Current &&
      MarketSeries.Close[lastBarIndex] >= movingAverage3.Result[lastBarIndex]

sell = rsi.Result[lastBarIndex] >= Overbought && rsi.Result[prevBarIndex] <= Overbought &&
       greenCandlePower <= MaxCandlePower && redCandlePower >= greenCandlePower &&
       MarketSeries.Close[lastBarIndex] <= ma1Current && MarketSeries.Close[lastBarIndex] <= ma2Current &&
       MarketSeries.Close[lastBarIndex] <= movingAverage3.Result[lastBarIndex]
23. RSI_Con_CPC_MA1MA2_MA3Nega
Buy: RSI latest ≤ oversold & RSI prev ≥ oversold & red candle ≤ Max & green candle ≥ red candle & closing ≥ MA1 & closing ≥ MA2 & closing ≤ MA3
Sell: RSI latest ≥ overbought & RSI prev ≤ overbought & green candle ≤ Max & red candle ≥ green candle & closing ≤ MA1 & closing ≤ MA2 & closing ≥ MA3
buy = rsi.Result[lastBarIndex] <= Oversold && rsi.Result[prevBarIndex] >= Oversold &&
      redCandlePower <= MaxCandlePower && greenCandlePower >= redCandlePower &&
      MarketSeries.Close[lastBarIndex] >= ma1Current && MarketSeries.Close[lastBarIndex] >= ma2Current &&
      MarketSeries.Close[lastBarIndex] <= movingAverage3.Result[lastBarIndex] sell = rsi.Result[lastBarIndex] >= Overbought && rsi.Result[prevBarIndex] <= Overbought &&
       greenCandlePower <= MaxCandlePower && redCandlePower >= greenCandlePower &&
       MarketSeries.Close[lastBarIndex] <= ma1Current && MarketSeries.Close[lastBarIndex] <= ma2Current && MarketSeries.Close[lastBarIndex] >= movingAverage3.Result[lastBarIndex]
24. MA1MA2 Cross
Buy: When MA1 crosses above MA2
Sell: When MA1 crosses below MA2
buy = ma1Previous <= ma2Previous && ma1Current > ma2Current
sell = ma1Previous >= ma2Previous && ma1Current < ma2Current
25. MA1MA2_CPC
Buy: MA1 crosses above MA2 & red candle ≤ Max & green candle ≥ red candle
Sell: MA1 crosses below MA2 & green candle ≤ Max & red candle ≥ green candle
buy = ma1Previous <= ma2Previous && ma1Current > ma2Current && redCandlePower <= MaxCandlePower && greenCandlePower >= redCandlePower
sell = ma1Previous >= ma2Previous && ma1Current < ma2Current && greenCandlePower <= MaxCandlePower && redCandlePower >= greenCandlePower
26. MA1MA2_CPC
Buy: MA1 crosses above MA2 & red candle ≤ Max & green candle ≥ red candle
Sell: MA1 crosses below MA2 & green candle ≤ Max & red candle ≥ green candle
buy = ma1Previous <= ma2Previous && ma1Current > ma2Current &&
      redCandlePower <= MaxCandlePower && greenCandlePower >= redCandlePower

sell = ma1Previous >= ma2Previous && ma1Current < ma2Current &&
       greenCandlePower <= MaxCandlePower && redCandlePower >= greenCandlePower
27. MA1MA2_RSIFilter
Buy: MA1 crosses above MA2 & RSI < Overbought
Sell: MA1 crosses below MA2 & RSI > Oversold
buy = ma1Previous <= ma2Previous && ma1Current > ma2Current && rsi.Result[lastBarIndex] < Overbought sell = ma1Previous >= ma2Previous && ma1Current < ma2Current && rsi.Result[lastBarIndex] > Oversold
28. MA1MA2_RSIFilter_CPC
Buy: MA1 crosses above MA2 & RSI < Overbought & red candle ≤ Max & green candle ≥ red candle
Sell: MA1 crosses below MA2 & RSI > Oversold & green candle ≤ Max & red candle ≥ green candle
buy = ma1Previous <= ma2Previous && ma1Current > ma2Current && rsi.Result[lastBarIndex] < Overbought &&
      redCandlePower <= MaxCandlePower && greenCandlePower >= redCandlePower

sell = ma1Previous >= ma2Previous && ma1Current < ma2Current && rsi.Result[lastBarIndex] > Oversold &&
       greenCandlePower <= MaxCandlePower && redCandlePower >= greenCandlePower
29. MA1MA2_MA3_RSIFilter
Buy: MA1 crosses above MA2 & price ≥ MA3 & RSI < Overbought
Sell: MA1 crosses below MA2 & price ≤ MA3 & RSI > Oversold
buy = ma1Previous <= ma2Previous && ma1Current > ma2Current &&
      MarketSeries.Close[lastBarIndex] >= movingAverage3.Result[lastBarIndex] &&
      rsi.Result[lastBarIndex] < Overbought sell = ma1Previous >= ma2Previous && ma1Current < ma2Current  &&
       MarketSeries.Close[lastBarIndex] <= movingAverage3.Result[lastBarIndex] && rsi.Result[lastBarIndex] > Oversold
30. MA1MA2_MA3Nega_RSIFilter
Buy: MA1 crosses above MA2 & price ≤ MA3 & RSI < Overbought
Sell: MA1 crosses below MA2 & price ≥ MA3 & RSI > Oversold
buy = ma1Previous <= ma2Previous && ma1Current > ma2Current &&
      MarketSeries.Close[lastBarIndex] <= movingAverage3.Result[lastBarIndex] &&
      rsi.Result[lastBarIndex] < Overbought sell = ma1Previous >= ma2Previous && ma1Current < ma2Current && MarketSeries.Close[lastBarIndex] >= movingAverage3.Result[lastBarIndex] &&
       rsi.Result[lastBarIndex] > Oversold
31. MA1MA2_MA3_RSIFilter_CPC
Buy: MA1 crosses above MA2 & price ≥ MA3 & RSI < Overbought & red candle ≤ Max & green candle ≥ red candle
Sell: MA1 crosses below MA2 & price ≤ MA3 & RSI > Oversold & green candle ≤ Max & red candle ≥ green candle
buy = ma1Previous <= ma2Previous && ma1Current > ma2Current &&
      MarketSeries.Close[lastBarIndex] >= movingAverage3.Result[lastBarIndex] &&
      rsi.Result[lastBarIndex] < Overbought &&
      redCandlePower <= MaxCandlePower && greenCandlePower >= redCandlePower

sell = ma1Previous >= ma2Previous && ma1Current < ma2Current  &&
       MarketSeries.Close[lastBarIndex] <= movingAverage3.Result[lastBarIndex] && rsi.Result[lastBarIndex] > Oversold &&
       greenCandlePower <= MaxCandlePower && redCandlePower >= greenCandlePower
31. MA1MA2_MA3Nega_RSIFilter_CPC
Buy: MA1 crosses above MA2 & price ≤ MA3 & RSI < Overbought & red candle ≤ Max & green candle ≥ red candle
Sell: MA1 crosses below MA2 & price ≥ MA3 & RSI > Oversold & green candle ≤ Max & red candle ≥ green candle
buy = ma1Previous <= ma2Previous && ma1Current > ma2Current &&
      MarketSeries.Close[lastBarIndex] <= movingAverage3.Result[lastBarIndex] &&
      rsi.Result[lastBarIndex] < Overbought &&
      redCandlePower <= MaxCandlePower && greenCandlePower >= redCandlePower

sell = ma1Previous >= ma2Previous && ma1Current < ma2Current && MarketSeries.Close[lastBarIndex] >= movingAverage3.Result[lastBarIndex] &&
       rsi.Result[lastBarIndex] > Oversold &&
       greenCandlePower <= MaxCandlePower && redCandlePower >= greenCandlePower


Reviews
There are no reviews yet.